When getting started with a modern machine learning library such as TensorFlow.js, you have to become comfortable with designing Artificial Neural Network (ANN) structures. An ANN is formed from a number of connected layers, each with a number of nodes (the equivalent of a biological neuron). When the model is trained, the parameters of these nodes (a weight and a bias) will be automatically determined based on the training data.
But machine learning is not fully automatic. As a machine learning engineer, you’ll need to decide on the structure of the model. The structure of the model is defined by hyperparameters. Whereas parameters are determined automatically during the training process, the hyperparameters are typically decided by the engineer. Hyperparameters include the number of layers and number of nodes. There are hyperparameters which apply to each node. For example, whether each node has a bias or not is a hyperparameter.
One of the most important hyperparameters is the activation function chosen for each node. Every node in the ANN has an activation function. Typically, the activation function is decided on a per-layer basis. Each layer might use a different activation function. For example, a typical structure for classification would be to use the sigmoid activation function for the first few layers, then softmax for the final layer.
What is an activation function?
An activation function defines whether the ANN node “fires”, and by how much. This is based on the biological neuron model where a neuron will “fire” if it is stimulated by neurons which feed into it.
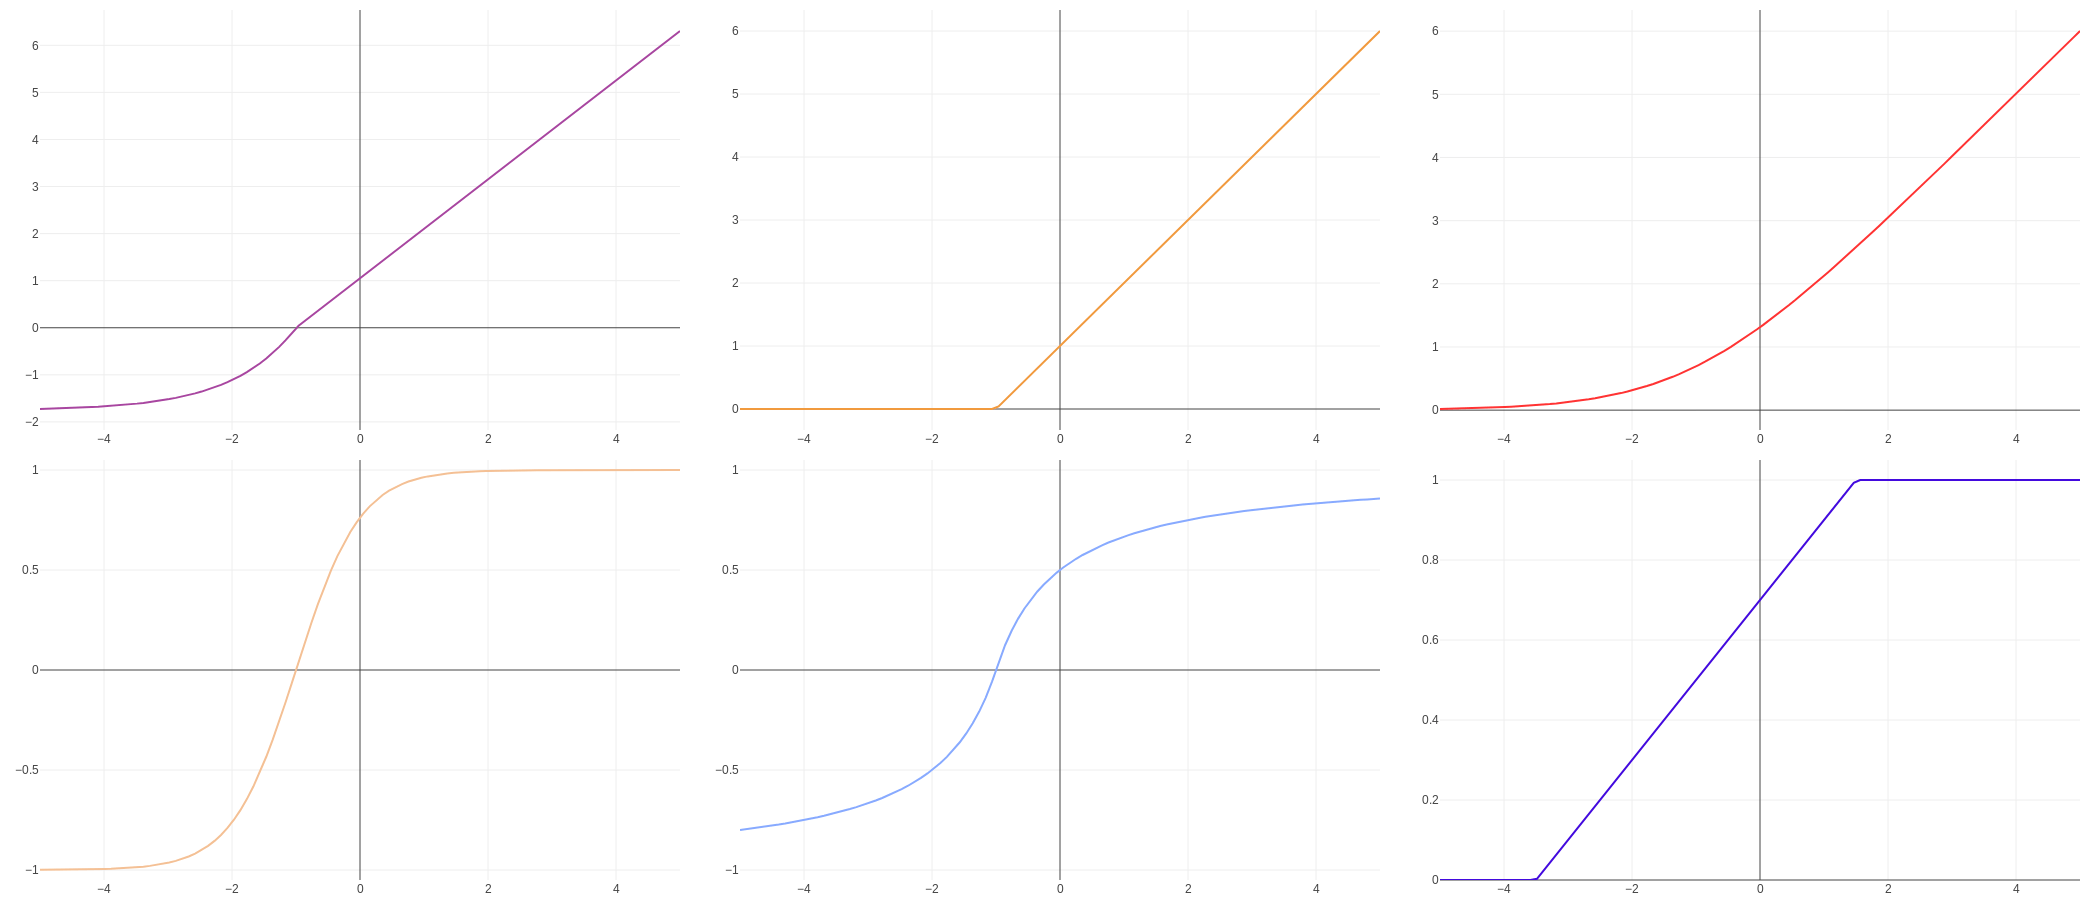
Activation functions are mathematical functions, and they have traditionally been taught as such. You may learn the mathematical definition and properties of a particular activation function, and for mathematically-minded students, this can be sufficient. But for those who prefer a more practical approach, it’s helpful to see the function plotted. Of course, it’s not uncommon to see machine learning textbooks include a diagram for popular activation functions, but we can do much better. The best way to gain an understanding of activation functions is to play with them yourself!
Interactive activation functions
Activation functions can look very different depending on the parameters of the node. So it is useful be able to see not only a generalised diagram of an activation function, but to be able to change the weight and bias and see how it looks then.
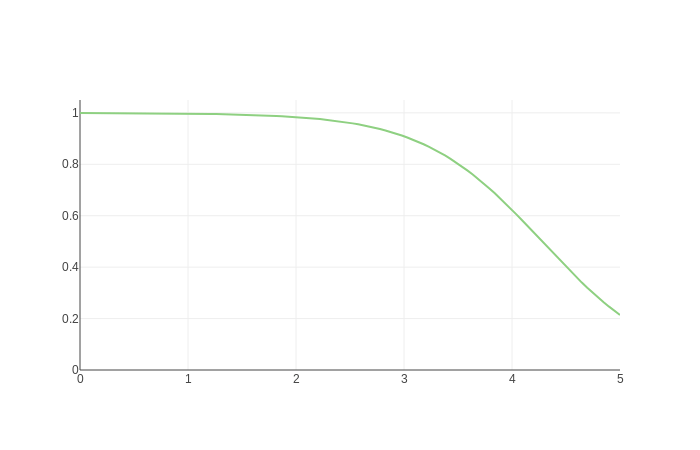
For example, a generalised diagram of a sigmoid curve looks like this:

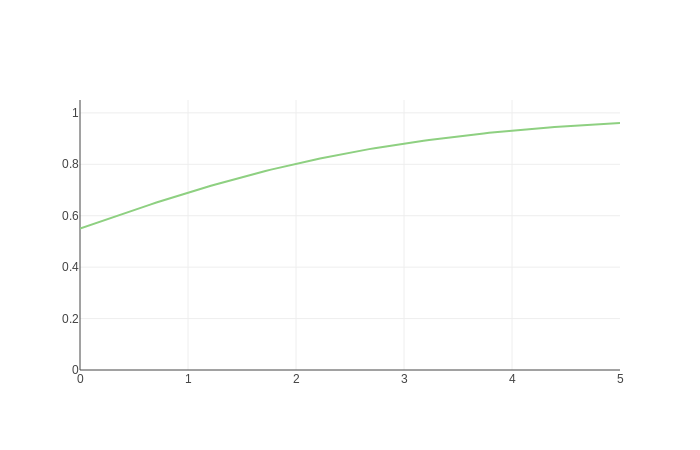
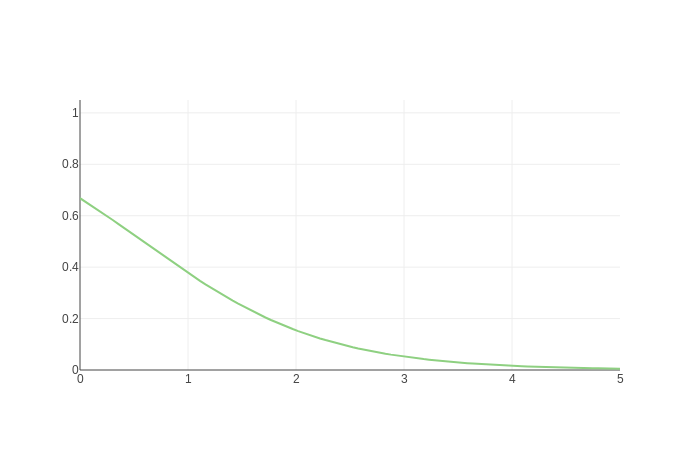
But depending on the weight and bias, it could also look like any of these:
I have created a visualisation tool to interactively plot activation functions with different parameters, so you can really get a feel for how they work. It uses TensorFlow.js, so it works right here in the browser without any backend component. It should be helpful to anyone trying to understand activation functions, whether you are using TensorFlow.js, TensorFlow with Python, any other neural network library, or even if you’re just learning the theory for now.
For those who plan to use TensorFlow.js, it is particularly helpful. What better way to visualise activation functions than using the library you are using? You can also be sure that what you see is what you will get when you use the library in your own project.
The tool demonstrates all the activation functions supported by TensorFlow.js: elu, hardSigmoid, linear, relu, relu6, selu, sigmoid, softmax, softplus, softsign, tanh. If other activation functions are later added, it will be easy enough to add those to the tool 🙂
Here it is:
(or access it here: https://polarisation.github.io/tfjs-activation-functions/)
Implementation
The tool is implemented using plain JavaScript, with TensorFlow.js to determine the output of the activation functions, and Plotly.js to visualise each activation functions. I could have used any other library than supports line charts, such as Chart.js. This was the first time I had used Plotly.js, but I found it worked very nicely. The toolbar, which allows the user to zoom in, pan, and download an image, is a handy feature.
In order to get an output for an activation function, we need to configure a simple model and pass in evenly spread input points (x-values) across the domain we wish to plot:
const xs = tf.linspace(min, max, 100);This creates a Tensor holding 100 values between the minimum and maximum x-value we want to plot. So if we want to view x values between 0 and 5, the linspace function will give us a list of values like: [0, 0.05, 0.1, …, 4.9, 4.95, 5.0] (these are approximate, in practice we are using floats and the values won’t be quite this neat). I chose 100 values because it provides just enough detail to create what looks like a curve, even though it will actually be 100 points connected by straight lines.
The output will be a range of y-values:
const ys = model.predict(xs.reshape([100, 1]))We get this by passing the input values into the model using model.predict(…). It was necessary to first alter the shape of the model using .reshape(…) on the Tensor, because .predict expects a 2-dimensional Tensor.
We’ll then be able to plot the [x, y] pairs to visualise the activation function, using Plotly.newPlot(…) (not shown here, because I want to focus on the machine learning aspects).
Thus far, I’ve omitted one key thing… before we can predict values using a model, we will need to define the model…
A simple machine learning model for demonstrating activation functions
The model we will use is just about the simplest possible in TensorFlow.js.
We create a model with a single layer containing a single node:
model = tf.sequential();
model.add(tf.layers.dense({
    units: 1, // Number of nodes
    useBias: true,
    activation: activationFunctionName,
    inputDim: 1,
}));
We use tf.sequential() to create a LayersModel, and add a dense layer – this is all pretty standard in TensorFlow.js. The layer has one node (units), and one input (inputDim). We will always use a bias (useBias), and the activation function will depend on what has been selected in the UI.
We then need to compile the model before we can use it:
model.compile({
    loss: 'meanSquaredError',
    optimizer: tf.train.adam(),
});
In this case, compiling the model seems fairly pointless, because we will not need to train the model, so will never use the loss function or optimizer that we specify. But we do still need to compile it before TensorFlow.js will allow us to make predictions. This will also initialise the model parameters (weight and bias), but they will be overridden by the values specified in the UI.
Overriding the weight and bias:
model.layers[0].setWeights([tf.tensor2d([[newWeight]]), tf.tensor1d([newBias])]
This sets weights for the first and only layer in the model (at index 0). In TensorFlow.js the setWeights(…) method refers to both the weight (which multiplies the input) and the bias (which is added to the input).
That’s basically all there is to the tool. The rest is plumbing and UI. The tool allows multiple activation functions to be selected for comparison, so in practice there is not only one model, but many. There is also some memory management in place (something that’s not typically necessary for JavaScript, but is necessary for TensorFlow.js because it utilises the GPU via WebGL).
I’ve made the source code available on GitHub and you can use the tool at https://polarisation.github.io/tfjs-activation-functions/, or above within this blog post. In future I’ll cover specific activation functions in more detail, but in the meantime, have a play!
This post © 2019 Justin Emery. Made available under a Creative Commons Attribution-ShareAlike 4.0 Licence.
Justin Emery is the instructor for Machine Learning in JavaScript with TensorFlow.js. He is also a working software developer with a decade of professional experience. He is a multilingual programmer having worked with Java, PHP, and Perl in the past, but now focuses mainly on full-stack JavaScript development. Based in the UK, he is available for software development projects on a freelance basis.


